Macroscope Manifesto
(Wed 11 Jun 2003 Greetings Smart Mobbers!
Note: as of Thu 02 May 2002 07:17 there is ongoing discussion of this paper at
http://www.usemod.com/cgi-bin/mb.pl?MacroScope
2-27-02
Jonathan Schull
Schull@DigitalGoods.com
978-764-1058
Copyright 2001-2002
patents pending
all rights reserved.
Introduction and Overview:
 Genes
spread through gene pools as biological agents spread through
populations, as messages propagate over the internet, as ideas
spread through communities, as tunes spread through popular
consciousness, as ideologies spread through societies.
Patterns of propagation, ramification, and repetition are the warp
and woof of life, mind, and culture. These patterns are usually
invisible. A “macroscope” could make them
visible. [i]
Genes
spread through gene pools as biological agents spread through
populations, as messages propagate over the internet, as ideas
spread through communities, as tunes spread through popular
consciousness, as ideologies spread through societies.
Patterns of propagation, ramification, and repetition are the warp
and woof of life, mind, and culture. These patterns are usually
invisible. A “macroscope” could make them
visible. [i]
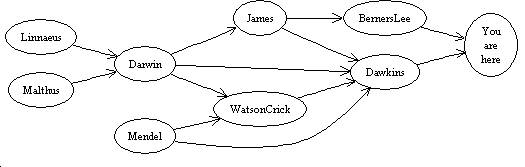
The profound importance of branching and interconnecting proliferative patterns has been established and celebrated by Malthus, Darwin, Mendel, Watson/Crick, William James, Richard Dawkins, Tim Berners-Lee, and many others[ii], but the problem remains under-appreciated and under-studied. The intra- and inter-disciplinary importance of this topic is increasingly clear to evolutionary theorists and graph theorists, to applied scientists such as epidemiologists and social network analysts, to educators, and even to those who must worry that distributed terrorist networks conspire over global networks of communication to release genetically-engineered bio-weapons into unprotected populations.
As pervasive as they are, these patterns are often overlooked because they exist in spatial, physical, temporal, and informational domains to which our sensory systems are not tuned. The purpose of this project is to make these phenomena visible, and studiable. We want to build a “macroscope” and apply it to a number of empirical research domains[iii]
Some patterns of branching and repetition are easily perceived in space, but not in time, nor in other domains. Branching patterns of foliage and of footpaths, for example, must have been obvious to our primate ancestors. But temporal branching patterns of evolving species were recognized only recently by Darwin. They are still not self-evident, and most visualizations of such patterns are still quite primitive, “counter-ergonomic”.
Other natural patterns such as music and speech are easily apprehended in time but not in space. But even here, major advances have come, and will come, with new techniques for producing relatively accessible visualizations of these patterns. Musical and linguistic notation systems have had a huge and ongoing impact in art and technology…but is there any reason to believe that those centuries-old visualization could not be improved or superceded by fresh application of 21st century technologies and insights?
Most natural patterns are not easily perceived, for they do not happen to produce lasting stimuli to which our nervous systems are attuned. But everything we know about biology, epidemiology, social networks, computational algorithms and data structures, tells us that branching patterns are “out there”, waiting to be mapped, illuminated, seen-anew. In the last few decades new data sources, new data-analytic tools, and new tracking techniques have become available to scientists and school children. It is now possible to envision a "macroscope” that present these invisible but ubiquitous patterns to human perceptual systems so that they would engage our innate ability to perceive millions of leaves as scores of trees...and a forest
This is a huge and exciting opportunity for science and for education. Visualization is often a prerequisite for understanding, and new tools for the visualization of natural phenomena have often inspired whole new sciences[iv]. A macroscope could provide new insight into new domains such as social and information networks, and into old domains such as music. It could be a new tool for perceiving, understanding, and studying recurrent patterns of the sort which are only now apparent to a select group of graph theorists, social scientists, and domain-specialists.
I want to develop…
- A perspective and a community which could help some of the most brilliant minds of the era grow and cross-fertilize their disciplines, and apply some of the most exciting ideas in contemporary science to some of the most pressing problems of our day. We propose to organize a workshop to bring together a small group of interdisciplinary pioneers for brainstorming and collaboration.
- A method for tracking the reproduction and propagation of email and other digital objects over unregulated internets.
- A psychologically-informed methodology for visualizing biological, sociological, and technological patterns of ramification and reticulation. We propose to use computers to generate stimuli that can be grasped by the best pattern recognition systems extant: the human brain. The goal is to make computers into better pattern renderers so that humans can become more versatile pattern recognizers.
Background
The propagation and proliferation of messages is the DNA of society, of cultural evolution and (literally) of life. Phenomena of social contagion are not well understood, because they have historically been difficult to study. But the structure and the proliferation of digital messages is eminently studiable, and digital messages are increasingly important determinant of human affairs, of commerce and of national security. Compared to the traditional world of communication via acoustic and electromagnetic waves, or manufacture and distribution of atom-based information objects, the new world of store-forward-and-copy networks is an unthinkably rich laboratory and field environment for the study of both new and old questions.
Digital object transmission is interesting in its own right, and interesting as a model system for the study of “biological-esque” phenomena. “Natural” learning and evolution occur when relatively successful variants increase their representation in adaptive networks such as gene pools and nervous systems. In enterprises, digital objects such as documents and executables are among the most important entities whose spread through the organization really does determine the enterprise’s character and behavior. Attaching “tracers” to these objects could give us unprecedented access and insight into the nature of organizational learning, into organizational “physiology” and structure, and into digital and biological ecologies and economies.
Such insights, and my background in biological psychology inspired me in 1992 to write a patent[v] and start a company based upon the recognition that digital objects like software and e-books proliferate over communication networks in ways that would require us to re-think the economics of information commerce. (“Information wants to be free”, and information creators need livelihoods.) The patent envisioned a “laissez faire distribution networks,” (now typified by the world wide web and by peer-to-peer file sharing systems such as Napster), and it disclosed how publishers of valuable digital goods could secure livelihoods, protect copyrights, and encourage and exploit copying.
(As deployed by Steven King and others during the great e-book boom of March 2000, SoftLocked digital goods invite prospects to try, buy, and pass along virally-self-vending copies of themselves that revert from “full-featured” to “demo” mode whenever they are transmitted new prospects. This may have been, and may still be, a solution to the “napster problem”, but subsequent experience has shown that neither rights-holders, policy-makers, nor consumers are perceptually, conceptually or strategically prepared to exploit the nature and the potential of the new information ecology.[vi] It’s still too hard to “get the picture.”)
To “get the picture,” one can map the phenomena. By putting “tracers” on digital objects, techniques originally developed in biology can be used to analyze such data. This was the premise of a second second patent concerned with tracking and analyzing “software lineages” or “pedigrees” which arise when digital objects are purchased, reproduced and redistributed. A few of the approaches envisioned in that patent have subsequently been put into practice by my co-workers at Digital Goods, and by other marketers. We found for example that consumer-to-consumer “viral redistribution” when it did occur could triggered purchases at a much higher rate than did traditional website-to-consumer distribution. But these methods have much broader applications to fundamental problems in the social sciences which remain virtually unexplored.
The biological, social, and evolutionary and commercial implications of this conception were also developed further in a third patent (still pending) which discloses methods by which differentially propagating digital objects (including computer viruses) might be given the ability to “mutate” and thereby adapt to local niches in the digital ecology[vii]. The resulting system could comprise a new experimental model for the study of social evolution, an empirical research methodology for the study of innovation diffusion and social contagion, and a novel technology for commercial product innovation.
While I have thus had a certain amount of success developing a biologically-inspired vision of information ecologies and applying them to internet business problems, I have been less successful in sharing this vision with those who might use it most effectively. I propose to address this challenge by attempting to build a system that will produce compelling and convincing visualizations of empirical phenomena that are today invisible and “merely theoretical.” By combining techniques for data collection, data mining, and information visualization with those of iterative software development and psychologically sound product design, we could produce an instrument (a “macroscope”) that would advance our understanding many sociological, epidemiological, organizational and commercial phenomena for which digital object propagation is a superb experimental model.
There are also many kinds of non-propagative temporal and structural phenomena, which would benefit from macroscopic scrutiny, and two problem domains in particular--music and biological rhythms—are appropriate “model systems” for prototyping a macroscope and for the refinement of our design methodologies.
We thus propose to develop and test a new research tool (a “macroscope”) by applying it in an ergonomically appropriate way to several worthy empirical problem domains.
The remainder of the proposal is organized as follows.
In the next section of this proposal we discuss the anticipated ergonomics of the macroscope, and propose to illustrate and refine our goals and methods through application to two “strong-signal” temporal problem domains in which data is already available, success is probable, and progress will be easy to recognize and appreciate.
In the next sections I will describe several worthy empirical domains where we propose to collect data. In each case, I indicate why that domain is interesting in its own right, and how “macroscopic scrutiny” could make a contribution.
In the last section, I consider some domain-general research questions that can be tested in the target empirical domains, and show that our approach can make fundamental contributions to many as-yet-unsynthesized disciplines that deal with proliferative bio-social phenomena.
Why, and how, to build an ergonomically-sound macroscope.
Why
Historically, science advances first through human recognition of patterns; mathematization follows. Natural History --usually, and appropriately--precedes analytical science[viii]. Both kinds of science usually precede artificial technologies for pattern recognition and analysis. So while one can dream of pattern recognition heuristics that would allow supercomputers to detect the kinds of phenomena we seek, we should not let such dreams forestall a more realistic ambition—allowing humans to detect, exploit, and appreciation of patterns and phenomena that today go unnoticed. Indeed, by pursuing these more realistic ambitions we may both hasten the arrival of such intelligent machines, and ensure that they will serve human goals, purposes and affordances.
In short, if we want to detect and exploit patterns in data, we should use the best available tool—the human perceptual system. We should invest in data visualization systems that help our innate perceptual intuitions discern and explore patterns imminent in the structure of the data.
It is easy to take our innate machinery for granted, so consider: as I look out the window, my visual system transforms millions of oscillations of color and brightness into a simple percept of a wind-swept lake. Above the far shore, gigabytes of high resolution data resolve effortlessly into a mixed-growth forest of pines, maples, oaks and birches. Across this tableau a wood pecker flies; its parabolic flight trajectory is a dead giveaway even though at this distance the bird’s coloration is invisible. Humans excel at this kind of thing, given these kinds of stimuli, and for good reasons. Our primate ancestors literally lived or died by virtue of their ability to leap through treetop canopies, navigating complex networks of interconnected vines and branches, capturing prey, evading predators, and interacting with collaborators, all the while making (literally) split-second life and death, mid-air decisions. Our nervous systems are constructed by the genes of those who did this best.
We propose to generate visual stimuli to which our nervous systems are pre-adapted from raw data whose internal structure (modulo computer-driven space-time transformations), can be mapped onto naturalistically-inspired visual displays. Untrained viewers should gain a sense of “place” and familiarity, from these displays, even when surveying terra incognita. Trained observers should be able see the forest and the trees, and amidst all of that, to detect patterns that don’t belong or warrant special attention.
How
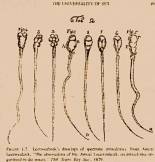
Arguably, Leeuwenhoek would have been set on the wrong track if he’d been shown an electron microscope or asked to visualize a mitochondrion. The electron microscope would have been too big a conceptual leap, the mitochondrion too distant a goal. I have the impression current workers in Information Visualization are “plagued” by instruments too complicated and data challenges too grand for optimal technology development. We are all eager to analyze financial markets and covert networks in which hitherto-undetected signals are guaranteed to be elusive. But we’d be well-advised to begin developing our tools and our intuitions in problem domains where we are sure to be find and appreciate the kinds of patterns we seek.
We will begin therefore by working with “low hanging fruit” --temporal and sequential patterns in model problem domains--that will help us subsequently develop more powerful techniques for more subtle phenomena. This is not “settling” for trivial problems. Galileo and Leeuwenhoek made breathtaking discoveries by focusing their instruments on phenomenal domains in which robust and apparent structures lay beyond just beyond the resolving power of the human eye (for Galielo, the surface of the moon; for Leeuuwenheek, I imagine, his own fingertips.)
Periodic Patterns
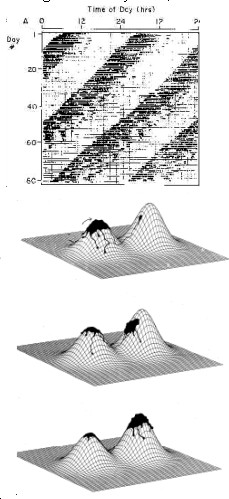
My first project on computer-enhanced data visualization dealt with biological rhythms, a field whose modern form was initiated when biological psychologist Curt Richter invented some now-routine data collection and visualization techniques. As illustrated below, Richter’s “actograms” allow investigators to “simply see” periodic behavioral patterns of activity spanning months or even years. When I entered the field in the 1980s, investigators (or their assistants) spent tedious hours cutting paper event records into strips, photocopying the strips and gluing them onto posterboard, or spent comparable amounts of time sitting in front of a computer terminal manually directing the painfully slow production of one actogram after another.

Figures adapted from from a teachers manual created by the NSF’s Science and Technology Center for Biological Timing http://www.cbt.virginia.edu/Olh/tmanual/TMan98.pdf
I developed a software package (“Tau”, still used in labs around the world) that could batch-process and analyze data while the investigator did better things with his time. Tau facilitated exploratory data analysis by pre-crunching data in order to instantly re-plot data at the investigators demand. One of the most important parameters (and one that was excruciating to explore when working with paper strips) was the time period at which the data were “wrapped” when creating the actogram (typically, but not necessarily 24 hours). With Tau, one can simply input the period one desires to see, and instantly see the results[ix].
There is more to be done. Traditional 2-D actograms (and Tau) require the investigator to specify a single presumptive periodicity. This can make it hard to see multi- periodic phenomena (e.g., a 5- day estrous cycle superimposed upon a 24 hour circadian rhythm, superimposed upon a 90 infradian rhythm). The problem (and the solution) is analogous to the problem one has when trying to visualize a three-dimensional brain structure by viewing a selected sampling of 2-D brain slices.
As illustrated below, the traditional 24 hour actogram is just one slice in a “temporal volume” that spans a continuous range of periodicities (Ackley, pers comm.). By depicting the full “temporal volume” as a “smoke-filled” space, one could visualize all periodicities simultaneously, with coherent periodicities emerging as relatively distinct layers of patterning.
 |
It remains to be seen whether one could perceive all of these periodicities simultaneously embedded within the homogeneous “smoke” that would fill non-coherent areas of this volume, but the solution would be to mimic the ergonomics of the microscope. We seek an experience similar to the microscope-facilitated “trip” one gets when adjusting the focus knob while looking at a drop of of pond water. In this case, a knob will allow us to glide smoothly through the full temporal volume, casting successive layers into sharp relief while defocusing others, all the while providing a “natural perspective” on the relationships, juxtapositions, and features we are interested in. Other interactive controls would allow one to pan and zoom to areas of interest, and to adjust the “pitch and yaw” in order to view the volume from other angles. (Indeed, by pointing the camera down from above, one essentially would essentially recapitulate the logic of the traditional periodogram. This demonstration would itself be helpful to students and others trying to grasp for the first time the logic of such mathematical analyses. )
This project will also allow us to begin developing a number of essential design methodologies.
- Strong Signal Domain. We begin with a phenomenal domain where we know that interesting patterns exist.
- Incrementalism. We extend known techniques and existing intuitions (e.g., those embodied in microscopes and 2D actograms) by taking small steps into still-familiar frontiers.
- Interactivity. We create technologies that will become virtual extensions of the user’s perceptuo-motor apparatus to produce effortless (pre-attentive) perception, facilitate exploratory data analysis, and to extend and develop innate perceptual, spatial, and kinematic intuitions.
- Ergonomic, iterative design and assessment. The user interface of this device will evolve over time, and be modifiable to fit the needs and tastes of its users.
- Multiple data sources. Although it was originally designed to analyze data from a specific data collection system, Tau accepted (and has been used to process) data in a variety of sources and digital file formats. The data-interfaces for our tools will similarly be designed to accommodate traditional as well as non-traditional data sources (e.g., data from server logs should reveal patterns of use and abuse in computer networks)[x].
Sequences.
Contemporary biologists urgently need tools for analyzing and visualizing genomic data; behavioral scientists, marketers, computer scientists, and traffic analysts wrestle with huge amounts of undigested sequential data from log files and network protocols; financial chartists struggle perennially to extract exploitable signals from market data. These are all pressing problem-areas, but I suggest we begin by applying our macroscope to the study of music. As we will see, there are surprising congruencies between music and the practical problem areas mentioned. But with music, we can be uniquely confident that there are strong and compelling signals to be found, and we can be aided by “inside access” to a pattern recognizer (the human auditory system) which is itself an interesting object of study. An initial focus on music will not only allow us to test new visualization and design methodologies against auditory intuitions, but immediately provide an interesting arena for collaboration, education, and alliance-building among students and practitioners of both art and science.
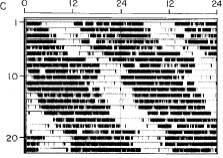
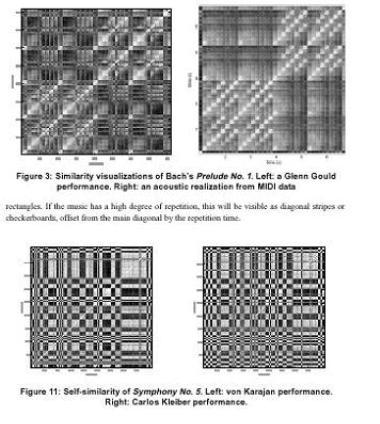
Apparently invented in 1970[xi], the “dotplot” identifies self-similarities in arbitrary sequences of data. Frequently used in bioinformatics for the detection of gene and protein sequences, dotplots have also been also been used for the analysis of software code, genetic algorithms, music analysis[xii] and digital detection of piracy and plagiarism in music and text. This is well-illustrated in the work of Jonathan Helfman of ATT labs (directly below and at right).
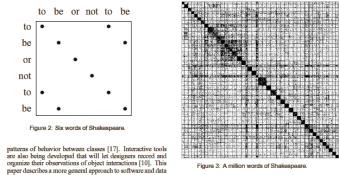
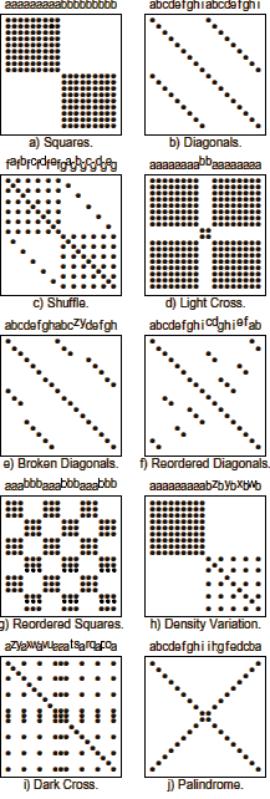
”Previous approaches to detecting similarity, such as algorithms that find longest common substrings or measures of angles in high-dimensional spaces, do not reveal the richness of the similarity structures that have been hidden in our software, data, literature, and languages. By plotting matches and relying on the human visual system to identify patterns of squares and diagonals, dotplots reveal similarity structures in data regardless of format and in text and software regardless of language.” http://imagebeat.com/dotplot/
Unfortunately, this is a system that exploits human visual systems without providing a great deal of edification to non-specialist humans, for whom relationships between dotplot patterns and data patterns is not obvious, although they can be taxonomized, and learned, as Helfman demonstrates, (at right). We will address that shortcoming by crossing it with another visualization recently developed by Wattenberg.
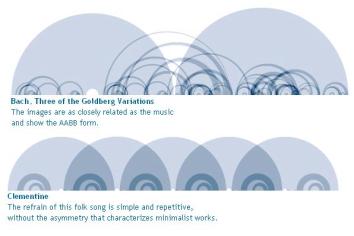
http://www.turbulence.org/Works/song/method/method.html
Although it is considerably more pleasing to the eye, Wattenberg’s “arc-plots” (my term) are unfortunately blind to key shifts, octave similarities, palindromes, and other common musical transformations. And neither arcplots nor dotplots are particularly helpful in helping untrained humans recognize specific melodies or to correlate their auditory and their visual percepts of musical structure.
So we seek a visualization that will address these deficiencies. The resulting macroscope should be useful for music education and analysis, as a model system for illuminating the nature of information visualization, and then for application to more subtle domains in which intentionally robust signals and patterns can not be counted on. The visualization will also (we hope and expect) be aesthetic visual interpretations of the music, interesting as static forms and “self-explanatory” when be unfolded in real time synchrony with the music. I believe the visualizations proposed below can be more illuminating, if not more dazzling, than the visualizations in the popular Windows Media Player and Real Player, whch render the “near-present” in real-time. In contrast, we seek to visualize an entire musical piece so that there are meaningful, understandable isomorphisms between the visual object pictured and the musical object being modeled.
Below, I sketch a style of visualizations that could embody an entire musical passage “losslessly” in the form of a 3D object from in rhythmic, melodic, and harmonic patterns can be perceived visually, and in which key changes, palindromes, and sequence reversals can be detected with less training and more intuitiveness than in traditional music notation. Although it will take a page of exposition to get there, the tentative design I have in mind will be recognizable as a straightforward evolutionary advance on the dotplot and the arcplot, albeit one which marries the their virtues and corrects their deficiencies. The productions that result should be multimedia “objets” in their own right, allowing artistic choices (such as the mapping of pitches to hues) without sacrificing rigor (such as a linear mapping of pitch to geometric height).
Design Goals (in order of
probability/difficulty.
Note that similar goals would apply to a more generic
macroscope for non-acoustic sequences)
Unique melodies produce unique visual patterns
Similar-sounding melodies produce similar-looking visual patterns
Complex- (or simple-) sounding melodies produce complex (or simple-) visual patterns
Naïve subjects can match melodies to their visual analogues.
Experienced subjects can hum/gesticulate/approximate melodies or rhythms by inspecting visualizations.
Real time rendering should elucidate underlying algorithms.
The
post-production fully rendered object should be a recognizable
atemporal 3D transform of the patterns it models.
Design Elements (in order of
specificity.)
(All choices subject to change as a result of iterative
testing and evaluation.)
Sounds in time à 3D objects in space.
Rigorous, redundant, and intuitive mappings across domains.
Temporal Duration à Lateral extension
FrequencyàVertical height and Whiteness (a linear dimension, like frequency)
Note (a cyclic dimension in octaves) à Hue
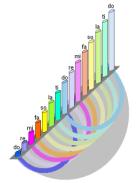
These design elements are illustrated and elaborated by this sketch of a two-octave ascending scale in which equal-duration notes are separated by brief periods of silence.
 Pitch will map to
both height and whiteness[xiii]. (The
mapping shown is ordinal by note; a linear height to frequency
mapping should also be explored.)[xiv]
Pitch will map to
both height and whiteness[xiii]. (The
mapping shown is ordinal by note; a linear height to frequency
mapping should also be explored.)[xiv]
The mapping of note hue is intended capture the cyclicity of successive octaves, in which notes separated by full octaves are perceived as the same “color” even though other notes intervene. We achieve this effect by mapping notes to a spiral and coloring the space over which the spiral travels in accordance with opponent process color theory. Thus, two orthogonal dimensions of the spiral (the sin and cosine) are mapped to the two orthogonal dimensions of the color system (red-green and blue-yellow), and the third radial dimension of the spiral is mapped to the third (black-white) dimension of the color system[xv]. (Other affordances of the opponent color system will be exploited later.)
Before proceeding, it’s worth pointing out several additional design methodologies illustrated by these proposals
· Incrementalism—as before we have extended the tried-and-true mapping of note to vertical position in music notation only slightly but augmented it substantially adding the color dimension.
· Psychologism—we are attempting to use modern knowledge of the human perceptual system to create a display which should correlate innate acoustic and innate visual intuitions in an ergonomically appropriate way.
· Empirical hypothesis testing. The claim just made about ergonomic correlation is eminently testable. Grafting a color scheme like this on a traditional music score (and /or piano keyboard) might demonstrably help students learn how to read music and interpret scores. If it did not, the virtues of this mapping technique could be questioned.
 We could now marry this
mapping to Wattenberg’s arcplot in order to produce a
visualization which is no longer blindness to similarities across
octaves, and from which melodic and rhythmic contours (or perhaps
patterns) are preserved and presented.
We could now marry this
mapping to Wattenberg’s arcplot in order to produce a
visualization which is no longer blindness to similarities across
octaves, and from which melodic and rhythmic contours (or perhaps
patterns) are preserved and presented.
A serious problem remains however. Arcs can only highlight pre-specified relationships (such as exact repetition) and will necessarily leave the viewer blind to many other relationships and transformations such as key-shifts, palindromes, etc. all of which “spontaneously” produce diagnostic eye-catching patterns in dot plots, as illustrated earlier.
The solution is to produce a dot plot variant that retains the specificity of our hue-plot while allowing the full (and unspecified) power of our visual pattern recognition systems to extract regularities from the visual display. Our addition of hue and height-based magnitude-encodings makes this possible.
What we are trying to produce is a dotplot whose cell values capture the degree of difference between cell-referents, rather than just sameness vs differentness. This will expose all sorts of patterns and transformations to which arcplots and dotplots are blind, but which our visual systems are very good at detecting.
 (The illustration at right is incomplete in that
only the leftmost edge has been colored; it will perhaps serve as a
design document.)
(The illustration at right is incomplete in that
only the leftmost edge has been colored; it will perhaps serve as a
design document.)
As shown, melody is is arrayed along the X and Y axes, and cell values are mapped to height and color on the Y axis as before. However, they are mapped in the reverse fashion on the X axis. Here, frequency varies with negative height and the color disk has been rotated 180 degrees so that redness and greenness are reversed, as well blueness and yellowness. This preserves the essential feature of the traditional dotplot, in that cells which match referents notes will have null values (0 height, 0 color. For the ascending series illustrated, this occurs only on the diagonals where each note matches and cancels itself. But now, cells within the matrix additionally encode note differentials. (For example, cells whose referent-notes differ by one note have height of 1 (or –1); and would have color values that differ by one position on the color wheel.)
If this is difficult to imagine (!), note that a view of this surface from overhead (collapsing the Z axis) will resemble a traditional 2D dot plot, albeit multicolored. Cells that reflect matches will still be distinctively marked (by the absence of color), but cells that reflect non-matches of their referents will now reflect the magnitude of the mismatch. This will render repetitions-with-key-shifts (for example) as regions of a distinctive color and height.
If this is still difficult to appreciate, hold your position overhead, remove color coding altogether and replace it with a grey scale correlated with height. While several dimensions of the music are now lost (full octave keyshifts are no longer salient) many aspects of the music, and the additive logic of the plot itself, remain evident. I have tried to illustrate this below.
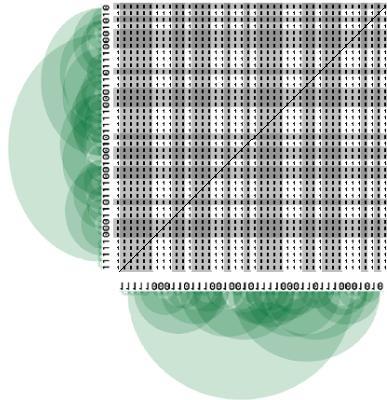
NoteGlyphs on the left and bottom edges (the melodies) are greyed in proportion to to acoustic pitch. The encodings are reversed for the Left edge vs the Bottom edge. NoteGlyphs in internal cells are greyed colored in proportion to the subtractive difference of their edge/anchors. (Thus, as in the dotplot, the diagonal cells are always Zero = medium grey.) With this method, melodies can be “read” off each edge, and identical sequences will create homogeneous medium-grey clusters. In contrast to Wattenberg’s method, keyshifts and other systematic transformations will have consistent and recognizable visual analogies.
If this is still hard to picture, I
urge you to help me implement this. The whole point is that
some things are easier to see than to describe!
 Proliferative (graph)
structures.
Proliferative (graph)
structures.
We come now to the primary data domain for which these methodologies have been developed—the domain of proliferative (branching) structures.
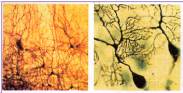
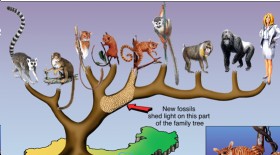
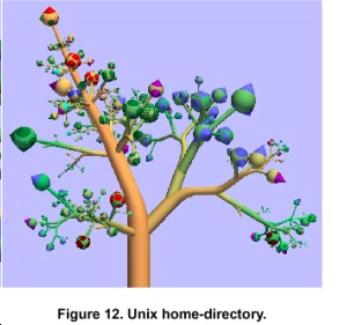
Even though branching structures play an important role in many domains, even though the drawing of tree-diagrams has played an important role in the development of theory and in the analysis of data[xvi], and even though there has been great progress in the computer rendering of naturalistic branching structures[xvii], there are very few cases in which investigators of proliferative phenomena have exploited the fact that primates (and other diurnal arboreal animals) have an uncanny and scientifically under-exploited ability to perceive and process naturalistic branching structures like trees, shrubs, vines, flowers, leaves, and spores[xviii]. The only applications that come to mind are the the cartoonish and questionable evolutionary trees common in biology textbooks, and a paper presented at last year’s InvoVis2001 conference (below left).
 Botanical Visualization
of Huge Hierarchies
Botanical Visualization
of Huge Hierarchies
Ernst Kleiberg_ , Huub van de Wetering †
,
Jarke J. van Wijk ‡ Department of Mathematics and Computer
Science
Eindhoven University of Technology
biology.uoregon.edu/Biology_WWW/ People/Saks/lab/Image9.gif
One need only compare the “botanical” visualization on the left to a traditional dendrogram on the right to see that “botanical visualization” of branching data patterns should greatly enhance our ability to “see the forest for the trees” when studying proliferative phenomena. (In truth, the two diagrams are based upon unrelated data, but who can tell?)
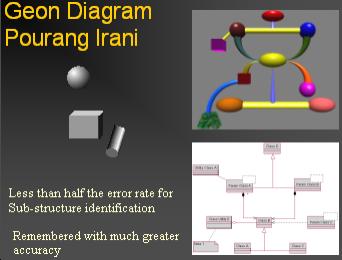 Empirical studies confirm show that 3D renderings of
contrasting the software schematic (UML) diagrams are substantially
easier to “get” than traditional 2D line renderings[xix]. Replication and
extension such usability results to my own research domains and to
the use of arboreal visualizations is to be important part of our
anticipated research program. As discussed earlier, our
biological ancestry as well as our familiarity with botanical
structures provides strong apriori support for the notion that
botanical forms are the ergonomically correct way to draw directed
graphs.
Empirical studies confirm show that 3D renderings of
contrasting the software schematic (UML) diagrams are substantially
easier to “get” than traditional 2D line renderings[xix]. Replication and
extension such usability results to my own research domains and to
the use of arboreal visualizations is to be important part of our
anticipated research program. As discussed earlier, our
biological ancestry as well as our familiarity with botanical
structures provides strong apriori support for the notion that
botanical forms are the ergonomically correct way to draw directed
graphs.
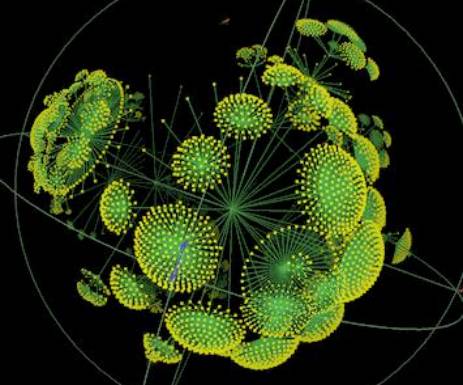
We have already begun developing 3D visualization software that uses 3D modeling techniques layouts to produce “naturalistic” renderings of the data. Following the “arboreal” approach of Kleiberg_ and Huub van de Wetering above the “Balls and arrows” of traditional network diagrams will be replaced by tapering branches whose diameter is proportional to the number of nodes “descending” from the branch in question. The temporal processes that produced these structures will be revealed both by the natural geometry of this rendering (ancestral trunks will be thicker than branches, ancestral branches thicker than descendant twigs) and by the dynamic growth of these structures on screen. Layout occurs through simulated attraction and repulsion “forces” which ensure that consistent characteristic fan-outs and shapes emerge as a natural consequence of graph parameters.
One of our goals is thus to render proliferative patterns so that it will be as easy to perceive the character of various datasets as it is to distinguish the “character” of an elm tree, vs an oak tree, vs a pine tree vs a palm tree. As we develop (and modify) this design we will be guided by psychological assessments in which we compare subjects ability to sort synthetic and empirical datasets into natural categories rendered when those data are rendered via traditional graph layout techniques vs those of the macroscope.
This instrument will be developed and applied to empirical data collected from several target domains.
Domain #1:
The spread of educational software into the elementary education
community.
Problem/Opportunity: Concord Consortium’s mission is to change the character of K-12 education by creating and disseminating software for computer enhanced learning. Supported by a $5M NSF grant they are about to begin marketing and distributing the first of their software products to the educational community.
Method: By attaching “tracers” to this software it will be possible, for the first time, to see and study the diffusion of these innovative software objects into educational organisms, and by performing macroscope-augmented network analysis on the resulting data it should be possible to identify scenarios like the one illustrated below.
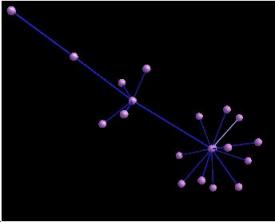
Tom Teacher downloads the software (from home, or to particular machine with a high bandwidth connection)
tries the software weeks later,
gets it on a few colleague's machines, and
suggests they look at it
One colleague installs it on a dozen machines in a classroom and uses the LAN to do it rather than downloading twelve fresh installers
Starting at the left we have your server, Tom, his 5 colleagues, and a dozen classroom machines.
We should be able to watch these trees grow day by day without laborious analysis of survey data.
(This picture is the final configuration of an animation we have successfully prototyped. “Arboreal” renderings are still in progress).
Exemplary Hypotheses and benefits:
School systems and communities of different character will manifest characteristic branching patterns; these will in turn be useful in predicting the receptivity of those communities to the infection by the software.
The visualizations will make it possible to identify specific individuals who play critical critical roles in spreading the software through their communities. (The “sneezers” to use a term now making the rounds in marketing circles. See Godin, Unleashing the Idea Virus.) This should in turn enhance the Consortium’s ability to support and cultivate such sneezers and thus advance their educational agenda.
Domain #2: Citation analysis
 Growth of academic enterprises as indicated by journal
citation patterns.
Growth of academic enterprises as indicated by journal
citation patterns.
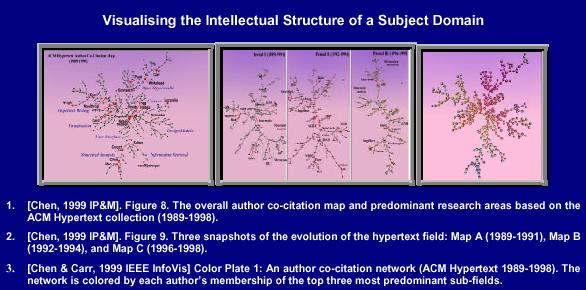
Chen’s work on citation patterns provides a tantalizing glimpse of the potential here and provides good arguments for the importance of such visualizations for the study of intellectual disciplines as wella s for the discipline of visualization. http://www.brunel.ac.uk/~cssrccc2/.
As implemented to date, Chen’s visualizations are a-temporal and non-spatial thus reflect “pure” citation relations without regard to the historical and social sequences that actually constrain their development. By “Temporalizing” and spatialization such representations, the incremental growth of a discipline would be more fully revealed and the relationship among branches more truly elucidated.
Here’s one way such a visualization might be attempted.
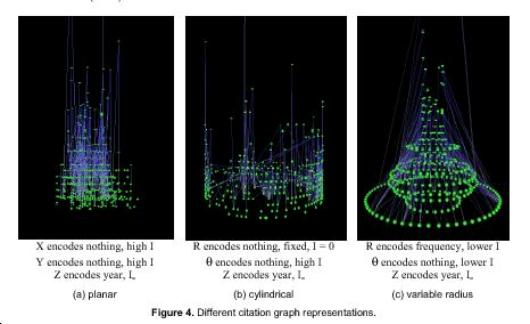
Imagine that we've spread a 2D map on a table depicting the academic landscape (in computer science, say) in North America in 1950. Research sites would be indicated by circles or rings, whose size was proportional to the number of publications (or authors) at that site in that year.
Now use the Z axis. Floating above the horizontal rings at ground level (1950) we draw another set of rings for research sites in 1951, 1952, etc. in successive ascending layers. The rings can now be seen as horizontal cross-sections of shafts, each of which represents a research site over time. If we render the shafts as volumes, the result might look something like a copse of bamboo. Sites that gain members get thicker as they ascend; sites that lose population get thinner. Finally, depict each migration event as a lateral thread going from one column to another.
With regard to within-slice circle placement...
At the first pass, I'd arrange the circles in each slice by latittude and longitude of author location (!) because we that will make a coherent manifold.
At the second pass, I'd use a cluster analysis based on "shared authors" to put related frequently collaborating sites close to each other.
An interesting hybrid would have the earliest slice be geographical, the latest slice be collaboro-centric, and to have the the influence vary from early to late. This would allow you to look at the distortion of geography by (e.g.,) academic alliances, commuter rail channels etc. So you could then do something analogous to the classic Steinberg cartoon of the New Yorker's view of the world.
Here is some related work based on the co-citation patterns (taken
from Infovis 1999. See http://lancet.mit.edu/~jayang/)
- Technology development in society studied through patent citation lineages
A second domain, of undeniable scientific, social and commercial significance is that of patent citation lineages the data on which is available to the public, online.
Exemplary hypotheses and benefits.for Domain #2
Different industries/disciplines will evince different branching patterns. These differences should be correlated with environmental and economic factors, with (domain-specific) implications for social policy, and for theories of progress and adaptation.
Practitioner’s understanding of their own disciplines and domains, their ability to recognize areas of growth, areas of particular promise, etc. will be enhanced by exposure to such maps.
Domain #3: The proliferation of email messages (and “spam”) through the global internet
Problem/Opportunity. In 1999, a Brandeis university student sarabande@brandeis.edu unleashed upon the world a chain-letter petition concerned with the plight of woman under Taliban rule in Afghanistan. Each recipients was urged to append his or her name to the petition and to pass it on. If you are the 50th or 100th or 150th signer, you were asked to send a copy back to sarabande@brandeis.edu , who would collect the signatures and bring them to the appropriate party.
However, it turns out that if you attempt to senda message to sarabande@brandeis.edu , you get an autoreply message from the Brandeis IT dept.
…signing this petition isn't likely do any good. First of all, the petition -- a well-meaning individual effort of one person at Brandeis University -- isn't going anywhere. The e-mail address it was to be directed to has been turned off. These days, anything sent to <sarabande@brandeis.edu> bounces, with the sender receiving a standard note from the mailer daemon to the effect that the account has been disabled due to volume. Earlier inquiries prompted the following auto-reply response:
|
Due to a flood of hundreds of thousands of messages in response to an unauthorized chain letter, all mail to <sarabande@brandeis.edu> is being deleted unread. It will never be a valid email address again. If you have a personal message for the previous owner of that address, you will need to find some means other than email to communicate. <sarabande@brandeis.edu> was not an organization, but a person who was totally unprepared for the inevitable consequences of telling thousands of people to tell fifty of their friends to tell fifty of their friends to send her email. |
In 1999 as many as two thousand messages a day were being sent to Brandeis. Yesterday (after years of autoreply discouragements) (January 15, 2002) 250 messages arrived. Since messages arriving at Brandeis on a given day probably represent 1/50th of all messages circulating on that day, one can estimate that approximately XX000,000 copies of this email message have proliferated along the internet; even more copies have been viewed (Over 500 copies are been preserved in googles archive of usenet newsgroups). Each of these messages has is accompanied by a list of 1 to 1000 names. Each message therefore documents its own pedigree. By harvesting only a few months’ worth of such messages we will be able to capture the social structure of a multi-million person social-contagion network, and analyze and visualize its properties.
Exemplary Research Issues for Domain #3
Different sub-trees of the “infection tree” will reflect different social sub-networks (this is already clear by inspecting the messages. Statistical and visual analysis will reveal that these subnetworks have distinctive characteristics.
Etc.
 Jonathan
Schull
Jonathan
Schull
I am a biological psychologist interested in the spread of adaptive patterns through information processing networks: genes in gene pools, action patterns through nervous systems, ideas through communities, digital objects through internets.
An early project on information visualization (“Tau”) was software for real-time transformation of temporal activity rhythms into spatial visual displays whose textures “call out” periodicities that are difficult to perceive in the temporal domain. (The current project attempts to extend this approach from periodic oscillations of simple quantities to multidimensional structured patterns of all kinds.)
I have also used visualization techniques to advance theoretical and philosophical understanding of the character of systems that adapt through variation and differential reproduction (see the illustration at right and from my publications Are Species Intelligent and The View from The Adaptive Landscape.)
Since 1992, I have used the theory of adaptive systems to found and build a 75-person public company (SoftLock.com, NASDAQ: DIGS) that developed a new and influential model for digital publishing, and have authored several patents (two issued, several pending) with important applications to the study and surveillance of computer viruses, information networks, network users, and the protection of commercial and human rights that could easily be compromised as digital culture infects and transforms society see www.digitalgoods.com .
For example, US patent 6266654, issued this past summer, discloses a system that can be used for remote tracking of “lineages of descent” that arise when electronic documents are copied from one person to another. The “digital paper trails” thus produced could be used to study the nature of the information ecology, create new branches of econometrics, monitor on electronic communications, or violate human rights. The Digital Goods patents are now for sale (see www.digitalgoods.com) but the ideas behind them are still fruitful, and multiplying.
One immediate research interest lies with the visualization and analysis of these “digital paper trails”, but the more general notion – the idea that when information patterns such as ideas, electronic messages, digital goods, and computer viruses are copied and transmitted through networks, they manifest characteristics, affordances, problems, and phenomena traditionally associated with plants, animals, ideas, and viruses-- has inspired, and could unify the activities of many of the most important developments in science and society today.