| |

|
Dienstag, 11. November 2003
|
|
^
^
"This type of model allows us to foresee in a more nuanced way what type of risk a community may face," said Ling Bian, associate professor of geography in the College of Arts and Sciences and author of the paper.
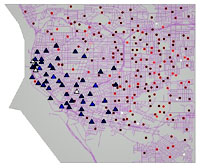
This map shows the spatial distribution of a simulated epidemic of a flu-like illness in Buffalo shortly before it peaks. Circles represent families, triangles workplaces.
9:54:55 AM 
|
|
^

|
© Copyright 2003 Ruth Pfosser.
Last update: 12.12.2003; 07:30:14.
|
|
| November 2003 |
| Sun |
Mon |
Tue |
Wed |
Thu |
Fri |
Sat |
| |
|
|
|
|
|
1 |
| 2 |
3 |
4 |
5 |
6 |
7 |
8 |
| 9 |
10 |
11 |
12 |
13 |
14 |
15 |
| 16 |
17 |
18 |
19 |
20 |
21 |
22 |
| 23 |
24 |
25 |
26 |
27 |
28 |
29 |
| 30 |
|
|
|
|
|
|
| Oct Dec |
|
|
